Peptide Purity Testing Statistics: What a Purity Pass Misses
By Peptide Care Index · Updated October 2026
In a 6,441-report preprint, about 36% of reports passing ≥98% purity still missed its amount benchmark, according to Peptide Care Index’s October 2026 analysis. These peptide purity testing statistics describe selected laboratory reports, not the whole market. The tables below separate purity, amount, identity, and endotoxin—and show why the denominator changes the answer. 1
What are the key peptide purity testing statistics?
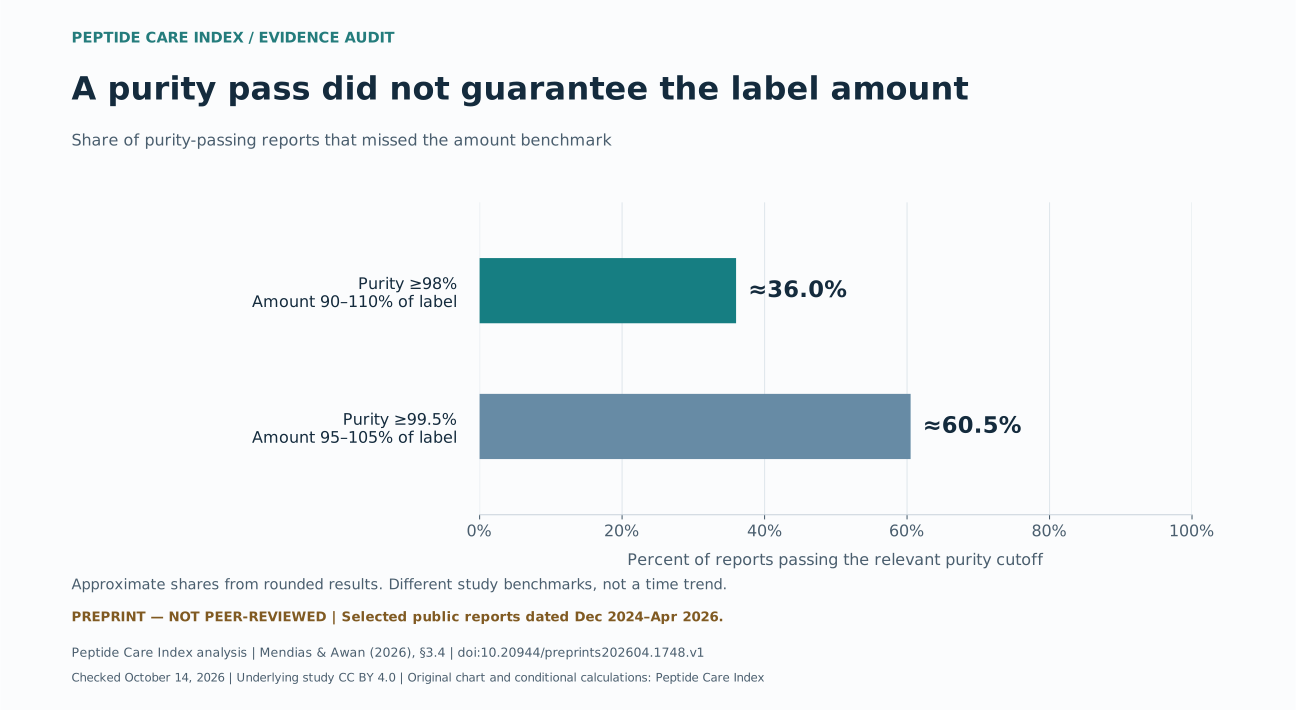
- About 36% of purity-passing reports still missed the amount benchmark. Peptide Care Index calculated this from the rounded results of Mendias and Awan’s April 2026 preprint: 32.8 ÷ (58.4 + 32.8). This model required ≥98% purity and 90%–110% of the label amount. 1
- About 60.5% of purity-passing reports missed the amount benchmark under the stricter model. Peptide Care Index calculated 44.3 ÷ (28.9 + 44.3) from the same preprint, using ≥99.5% purity and 95%–105% of the label amount. These are different cutoffs, not a change over time. 1
- 6,441 reports entered the 2026 preprint’s combined quality analysis. They covered 14 compounds and 203 companies, with report dates from December 17, 2024, through April 3, 2026. Consumers and companies submitted the samples voluntarily. 1
- 156 of 6,441 reports, or 2.4%, did not contain the stated peptide. The preprint retained these reports in its combined quality analysis but excluded them from its amount and purity summaries. 1
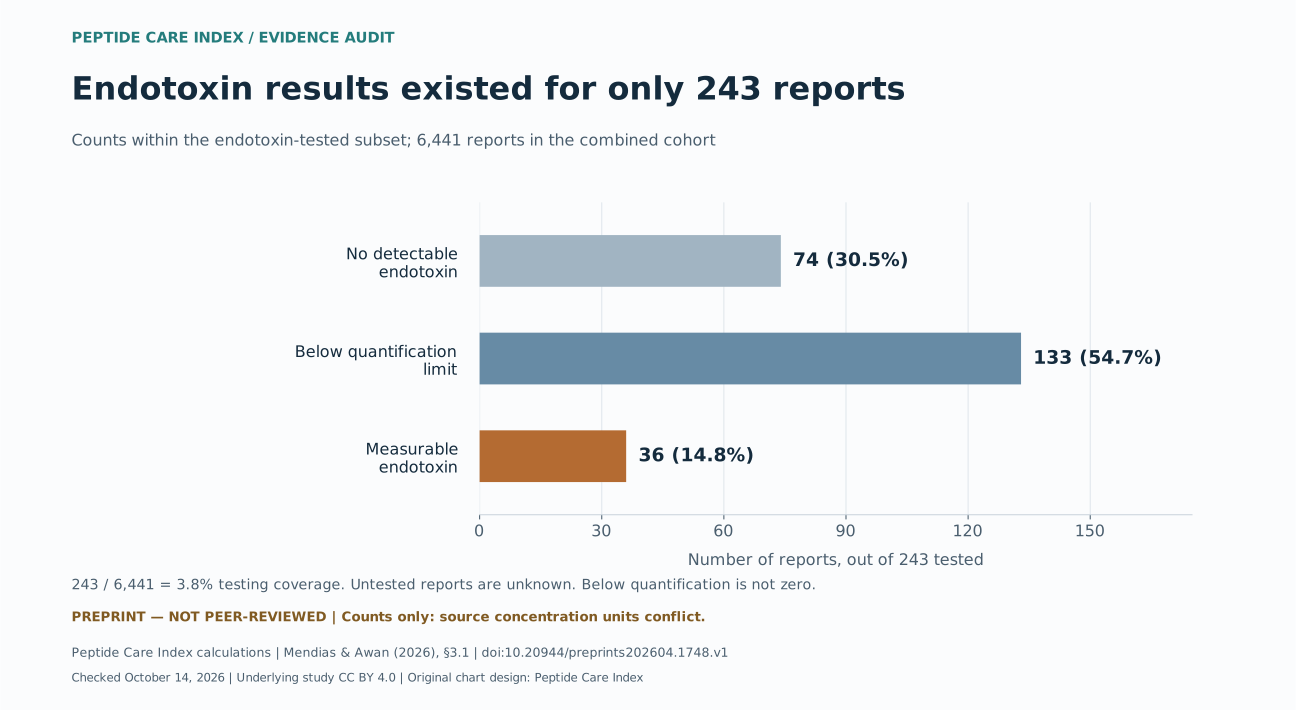
- Only 243 reports had endotoxin results: 3.8% of the 6,441-report combined cohort. The other reports cannot be treated as endotoxin passes. The percentage is Peptide Care Index’s calculation from the preprint’s counts. 1
- 36 of the 243 endotoxin-tested reports had measurable endotoxin: 14.8%. The 2026 preprint separately listed 74 with no detectable endotoxin and 133 below its quantification limit. This is a tested-subset result, not a market contamination rate. 1
- Three semaglutide products in a 2024 paper contained 28.56%–38.69% more semaglutide than their labels stated. The samples came from selected sellers offering products without a prescription; they do not represent all semaglutide products. 2
- Melanotan II vials in a 2015 paper contained 4.32–8.84 mg against a 10 mg label. That equals 43.2%–88.4% of the label amount, calculated by Peptide Care Index from the published range. 4
- A 2018 study of 27 peptide preparations yielded 19 numerical LC-purity values; eight were not calculable with its UV method. Peptide Care Index counted the numerical entries and retained the other results as unknown, not 100% purity. 8
How often did a purity pass miss the amount benchmark?
About 36.0% of reports that passed the preprint’s ≥98% purity cutoff fell outside its 90%–110% label-amount range. Under the stricter model, the corresponding share was about 60.5%. Both are Peptide Care Index calculations from rounded percentages in a preprint that has not been peer-reviewed. 1
Table 1. Reported quality outcomes under the preprint’s two models
| Outcome | ≥98% purity; amount 90%–110% of label | ≥99.5% purity; amount 95%–105% of label |
|---|---|---|
| Passed purity and amount | 58.4% | 28.9% |
| Passed purity; failed amount | 32.8% | 44.3% |
| Passed amount; failed purity | 3.0% | 8.4% |
| Failed purity and amount | 3.3% | 15.9% |
| Did not contain the stated peptide | 2.4% | 2.4% |
| Amount failures among reports that passed purity—our calculation | About 36.0% | About 60.5% |
Source: Mendias and Awan, 2026 preprint, Methods §2.2 and Results §3.4; 6,441 reports in each model. The first five rows use that full denominator. The last row uses only the reports passing the relevant purity cutoff. Source category totals are 99.9% because of rounding. 1
The first calculation is 32.8 ÷ (58.4 + 32.8) × 100 = about 36.0%. The denominator adds both groups that passed purity. It does not include reports that failed purity or lacked the stated peptide.
Put plainly: among the reports that cleared that purity cutoff, roughly 36 in every 100 still missed the amount range. That is a description of this report collection—not the odds for a vial someone might buy.
Are these FDA pass-or-fail standards?
No. The authors chose ≥98% and ≥99.5% purity cutoffs for their two comparison models. The paper explicitly says those cutoffs are not universal specifications for compounded or FDA-approved peptide products. Passing either model does not establish a product’s safety, approval, or eligibility for use in a person. 1
The authors call the models “Compounded Standards” and “Manufactured Standards.” Those names describe the comparisons they built. They do not mean the researchers tested representative samples of the regulated drug supply or made FDA compliance decisions. For the separate regulatory question, see our FDA peptide compounding reference.
How many peptide products were actually tested?
The large 2026 analysis began with 6,487 reports, excluded 46 incomplete reports, and retained 6,441 for its combined quality analysis. Its amount-and-purity summaries used 6,285 reports after excluding 156 that lacked the stated peptide. Report counts are not necessarily counts of unique batches. 1
Table 2. Different questions require different denominators
| Evidence | What the denominator represents | What it can support | What it cannot support |
|---|---|---|---|
| Mendias and Awan, posted 2026 | 6,441 public reports for combined identity/amount/purity outcomes; 6,285 for amount/purity summaries; 243 for endotoxin | Results for this selected report collection, under stated models | A market failure rate, unique-batch count, or rate for all products from a company |
| Ashraf and colleagues, 2024 | Three delivered semaglutide products from six attempted seller purchases | Product-level amounts and powder weight fractions for those three products | A failure rate for all online peptides, all pharmacies, or approved medicines |
| Breindahl and colleagues, 2015 | 26 melanotan II vials analyzed, from 73 bought in 2011 across three selected shops | Measured amount range and impurity findings in those 26 vials | A current market-wide purity or underfill rate |
| Janvier and colleagues, 2018 | 27 preparations across 10 compounds; 19 numerical LC-purity results | Compound- and preparation-specific impurity findings | A numeric purity result for the eight uncalculable preparations or a market rate |
Sources: primary reports 1, 2, 4, and 8. Observation dates and access depth are recorded in the download.
The 2024 semaglutide findings appeared in both JAMA Network Open and the Journal of Medical Internet Research. The longer paper says it expands the earlier research letter. These are two publications about the same purchase cohort, not two independent sets of three products. 2 3
Nor should the older purchases be added to the 2026 reports to create one giant “failure rate.” Their selection methods, compounds, tests, and definitions differ.
What percentage had measurable endotoxin?
In the 2026 preprint, 36 of 243 endotoxin-tested reports had measurable endotoxin—14.8%. That subset covered only 3.8% of the combined 6,441-report cohort. The result does not tell us whether untested reports would have passed or failed. 1
Table 3. The preprint’s endotoxin results, with the tested denominator
| Reported category | Reports | Share of the 243 tested reports |
|---|---|---|
| No detectable endotoxin | 74 | 30.5% |
| Below the quantification limit | 133 | 54.7% |
| Measurable endotoxin | 36 | 14.8% |
| Total | 243 | 100.0% |
Source: Mendias and Awan, Results §3.1. Counts are reported by the authors; percentages are Peptide Care Index calculations. 1
“Below the quantification limit” means the assay could not reliably put a number on that result. It is not the same as “none detected.” Neither phrase means a product has passed every safety test.
Why are no endotoxin concentrations shown here?
The preprint’s Results section uses EU/mL, while its Figure 2 caption uses EU/vial. EU means endotoxin units. Those concentration and per-container units are not interchangeable without more information. We preserve the clear counts and leave out the unresolved concentrations. 1
The 2024 semaglutide paper has a different problem: its abstract describes endotoxin in all three samples, but the detailed Results give two values with “less than” signs and one numerical measurement. Those two upper bounds do not establish positive detections. We therefore do not publish a “three out of three contaminated” statistic from that paper. 2
Endotoxin testing and testing for living microorganisms answer different questions. FDA’s technical guide to bacterial endotoxins explains that these bacterial materials can persist after bacteria die. A purity percentage alone does not answer either question. 6
What did purity tests find in other peptides?
A 2018 study obtained 27 preparations of 10 peptides from three selected sellers. Its published table supplied 19 numerical LC-purity values; eight further preparations had no calculable value with the UV impurity method. This historical sample set shows why missing results must stay separate from passes. 8
Table 4. LC-purity values from the 2018 study, by preparation
| Peptide | Seller X | Seller Y | Seller Z |
|---|---|---|---|
| AOD-9604 | 45.9% | 4.8% | 4.8% |
| CJC-1295 without DAC | Not calculable | Not calculable | Not calculable |
| Epitalon | 94.6% | 80.1% | 89.8% |
| GHRP-2 | 99.6% | 99.4% | 99.9% |
| GHRP-6 | 99.6% | 98.2% | 97.0% |
| Ipamorelin | 97.7% | 98.3% | 98.6% |
| Melanotan II | 98.5% | 98.5% | Not in sample set |
| Oxytocin | 74.8% | 71.7% | Not in sample set |
| Sermorelin | Not calculable | Not calculable | Not in sample set |
| Thymosin beta-4 | Not calculable | Not calculable | Not calculable |
Source: Janvier and colleagues, 2018, Tables 1 and 3 and Results §3.1. X, Y, and Z are the paper’s seller codes. Values describe its chromatographic method, not total powder mass or clinical suitability. The CSV preserves all 27 preparation rows. 8
“Not calculable” does not mean impurity-free: the authors identified related impurities with mass spectrometry even where the UV method did not yield a numeric purity result. Their method also excluded solvent and mannitol peaks. The paper’s AOD-9604 discussion says 4.5% where Table 3 says 4.8%; the table above preserves Table 3 and flags that conflict. 8
The table is useful for understanding the evidence. It cannot rank present-day suppliers, and these results must not be averaged with the 2026 report collection to create a market purity score.
Were online semaglutide products really only 7%–14% pure?
The 2024 JMIR paper reports 7.70%–14.37%, but its table shows semaglutide mass as a share of total powder weight. These figures are not a like-for-like comparison with an HPLC purity percentage. The paper also reports finding no peptide-like impurities with its analysis; it did not identify all remaining powder components. 2
Table 5. What the three semaglutide products actually contained
| Product label in the 2024 paper | Total powder | Label amount | Measured semaglutide, mean (SD) | Reported semaglutide share of powder, mean (SD) | Reported excess above label |
|---|---|---|---|---|---|
| Biotech Peptides | 50.1 mg | 3 mg | 3.86 mg (0.14) | 7.70% (0.28) | +28.56% |
| SemaSpace | 19.3 mg | 2 mg | 2.77 mg (0.12) | 14.37% (0.63) | +38.69% |
| USChemLabs | 14.9 mg | 1 mg | 1.34 mg (0.07) | 8.97% (0.51) | +33.58% |
Source: Ashraf and colleagues, JMIR 2024, Table 4. SD means standard deviation; for percentage entries it is expressed in percentage points. Product names identify historical samples, not current suppliers or recommendations. 2
For example, 3.86 mg ÷ 50.1 mg × 100 ≈ 7.70%. That is a mass fraction. It does not, by itself, show that the other 92.30% was harmful contamination. Nor does a high HPLC purity figure prove the vial has the amount printed on the label.
The published masses are rounded. We retain the paper’s reported excess percentages rather than claiming to recover their full precision from the rounded masses.
The older melanotan II paper gives another clear example of the difference: the reported amount range, 4.32–8.84 mg, was below the 10 mg label even though the investigators also measured impurity levels separately. 4
What does a 99% purity result actually tell you?
A 99% HPLC purity result describes the target signal relative to the signals measured by that method. It does not mean 99% of the vial’s entire powder weight is the target peptide. Bachem’s analytical guidance separates HPLC purity, net peptide content, and gross weight for that reason. 5
Table 6. Five different questions hidden behind “tested”
| Question | Result to look for | What that result alone does not establish |
|---|---|---|
| Is the named compound present? | An identity test using a suitable analytical method | How much is present, biological activity, or safety |
| How clean is the measured chemical profile? | Chromatographic purity, with the method and detection conditions | Total powder composition or every possible contaminant |
| How much target peptide is present? | A quantitative amount result, with units and a reference method | Sterility or endotoxin results |
| Were living microorganisms detected? | A separately reported microbiological test | Absence of endotoxin |
| Was endotoxin measured? | A separate endotoxin result, units, and detection/quantification limits | Absence of every other contaminant or suitability for human use |
Sources: Bachem’s analytical guidance, the primary studies’ methods, and FDA’s endotoxin guide. 1 2 5 6
Also check whether the report identifies the tested product, batch, sample, date, and laboratory. A report for raw material does not establish the contents of every finished product. Our capsule label and laboratory-report questions explain that distinction for finished capsules.
If you are comparing care options, Find My Peptide Path helps you organize evidence and provider questions. A laboratory report is not medical clearance. FDA advises patients seeking GLP-1 treatment to use a prescription and a state-licensed pharmacy, and warns about products sold to consumers under false research-use labels. 7
How did we build these statistics?
We checked the primary evidence on October 14, 2026. We extracted reported counts and measurements, kept overlapping publications together, and calculated the conditional percentages and coverage rates shown here. We did not purchase products, test samples, or reanalyze the underlying 6,441 laboratory reports.
For the 2026 preprint, we read the manuscript, methods, figure captions, and supplement. For the 2024 semaglutide work, we used the longer JMIR report and checked its relationship to the JAMA Network Open letter. We also checked the 2018 published PDF against the accepted manuscript and read the 2015 accepted manuscript. The download records access depth for each publication.
Our calculation rules are simple:
- Keep the unit visible. A report, product, vial, company, and batch are different units.
- Use the tested denominator. Endotoxin results use 243 reports, not 6,441.
- Separate reported values from our math. The CSVs identify both and give the formulas.
- Preserve rounding and less-than signs. An upper bound is not a positive detection; rounded percentages cannot produce exact report counts.
- Keep conflicting evidence visible. We do not resolve contradictory units or abstract/body claims by choosing the more dramatic number.
The site’s research methodology explains our wider source and correction policy.
What can’t these data show?
They cannot establish the percentage of all research peptides that are mislabeled, impure, contaminated, safe, or unsafe. The 2026 collection used voluntary consumer and company submissions. The older purchase studies selected particular sellers. Neither is a random market sample. 1 2
The preprint does not provide a frozen row-level dataset in its supplement or describe an explicit method for removing repeat batches. We therefore call its units reports and reproduce its published summaries. We do not claim an independent audit of every certificate, calculate new supplier rankings, or treat thousands of reports as thousands of independent manufacturers.
Finally, the data do not show whether a peptide works for an injury or illness. Chemical quality, clinical evidence, regulatory status, and the right care for a person are separate questions.
How can you cite or download these data?
For the 36% conditional calculation, cite this analysis and identify the underlying preprint. For a laboratory result we reproduce, name the original researchers and their actual sample group.
Suggested citation: Peptide Care Index. Peptide Purity Testing Statistics: What a Purity Pass Misses. Updated October 2026; evidence-audit edition October 14, 2026. https://peptidecareindex.com/research/peptide-purity-testing-statistics/. Original conditional analysis of Mendias and Awan, 2026, doi:10.20944/preprints202604.1748.v1, a non-peer-reviewed preprint.
Original analysis and chart designs may be reused with credit to Peptide Care Index. Underlying source material retains its original attribution and license terms.
The free downloads contain extracted published results and our calculations—not the preprint’s original 6,441 reports:
- Study inventory CSV
- Quality-model results CSV
- Endotoxin subset CSV
- 2024 semaglutide sample data CSV
- Calculation ledger CSV
- 2018 peptide preparation data CSV—all 27 rows
- 2015 melanotan II vial data CSV—all 26 rows
- Purity-versus-amount chart: PNG · SVG
- Endotoxin chart: PNG · SVG
What else do readers ask about peptide testing?
What percentage of research peptides fail purity testing?
There is no defensible market-wide percentage in these sources. The 2026 preprint’s often-cited 41.6%–71.1% range combines identity, amount, and purity under two selected models; it is not a purity-only failure rate. Its sample collection was not representative of the market. 1
Can a peptide be 99% pure but contain the wrong amount?
Yes. Purity and amount are separate measurements. In the lower-cutoff preprint model, 32.8% of all 6,441 reports passed purity but missed the amount range; among purity passes, that was about 36%, calculated from the rounded source shares. 1
Does 99% purity mean a peptide is sterile or safe to inject?
No. A 99% purity result is not a sterility test, endotoxin test, or clinical safety finding. The 2026 preprint had endotoxin results for only 243 reports, and passing its limited quality models did not amount to a full product safety assessment. 1 6
Is the 2026 analysis a peer-reviewed study?
No. The source checked on October 14, 2026, was version 1, posted April 24, 2026, and marked not peer-reviewed. The 36% and 60.5% figures on this page are our calculations from its reported summaries, with that limitation carried forward. 1
Which sources support these statistics?
- Mendias CL, Awan TM. Evaluation of Research Grade Peptides Marketed Directly to Consumers Reveals Extensive Variability in Purity and Measured Abundance. Preprints.org, version 1, posted April 24, 2026. Not peer-reviewed. Full manuscript; DOI. Methods §2.1–2.2, Results §3.1–3.4, Figures 1–2 and 7, limitations, and supplement checked October 14, 2026. © 2026 the authors; CC BY 4.0. Our extra calculations and charts are identified as adaptations.
- Ashraf AR and colleagues. Multifactor Quality and Safety Analysis of Semaglutide Products Sold by Online Sellers Without a Prescription. Journal of Medical Internet Research. 2024;26:e65440. Full article; Table 4; doi:10.2196/65440. Methods, Results, cohort overlap, and abstract/body conflict checked October 14, 2026. © 2024 Amir Reza Ashraf, Tim Ken Mackey, Róbert György Vida, Győző Kulcsár, János Schmidt, Orsolya Balázs, Bálint Márk Domián, Jiawei Li, Ibolya Csákó, András Fittler. Originally published in the Journal of Medical Internet Research (ISSN 1438-8871), November 7, 2024. CC BY 4.0; table extraction is adapted and relabeled here to make the endpoint explicit.
- Ashraf AR and colleagues. Safety and Risk Assessment of No-Prescription Online Semaglutide Purchases. JAMA Network Open. 2024;7(8):e2428280. DOI and article. Earlier report of the same purchase cohort; not an additional three products. Publication identity and overlap checked October 14, 2026.
- Breindahl T and colleagues. Identification and Characterization by LC-UV-MS/MS of Melanotan II Skin-Tanning Products Sold Illegally on the Internet. Drug Testing and Analysis. 2015;7(2):164–172. DOI; author university record and abstract. Published amount range and shop count checked October 14, 2026; full-text access depth is specified in the inventory.
- Bachem. FAQ: analysis of peptides. HPLC purity, assay, net peptide content, and gross weight definitions checked October 14, 2026.
- U.S. Food and Drug Administration. Bacterial Endotoxins/Pyrogens. Technical background on endotoxin and microorganisms; checked October 14, 2026.
- U.S. Food and Drug Administration. FDA’s Concerns with Unapproved GLP-1 Drugs Used for Weight Loss. Patient recommendations and false research-use marketing warnings; checked October 14, 2026.
- Janvier S and colleagues. Impurity Profiling of the Most Frequently Encountered Falsified Polypeptide Drugs on the Belgian Market. Talanta. 2018;188:795–807. DOI; published PDF at the authors’ institute; university record. Methods, Tables 1 and 3, Results §3.1, and table/text discrepancy checked October 14, 2026. Numerical results are transcribed facts, not a republication of the original table design or prose; underlying article rights remain with its rightsholder.
Peptide Care Index Research is the research and reference section of peptidecareindex.com.