Peptide statistics: $71 billion from five drug brands
Five semaglutide and tirzepatide brands recorded about $71.0 billion worldwide in 2025. Tirzepatide supplied 79.3% of the 2024–2025 worldwide sales increase across five semaglutide and tirzepatide brands, according to Peptide Care Index’s October 2026 analysis of company reports. These peptide statistics separate sales, use, and approval facts. The full table shows every brand and source. Sources 1–5.
Which peptide statistics matter most?
- $71.0 billion in 2025: worldwide sales of the five brands in Peptide Care Index’s analysis of Novo Nordisk and Lilly reports, translated with annual exchange rates. Not the whole peptide market.
- 79.3% of the 2024–2025 increase: tirzepatide’s contribution to that five-brand group’s worldwide sales growth, calculated by Peptide Care Index. Calculation and source rows.
- 55.3% annual growth: the five-brand group’s worldwide sales increase from 2024 to 2025 in Peptide Care Index’s annual-average-dollar calculation. Method and sources.
- 12% of U.S. adults: current use of GLP-1 medicines—drugs used for weight loss or chronic conditions—in KFF’s February–March 2026 poll. This is not a measure of all peptide use.
- 11% of U.S. adults: current GLP-1 use for weight loss in Gallup’s May–June 2026 survey, using its September revision.
- 26.5% of adults with diagnosed diabetes: U.S. GLP-1 injectable use in 2024, according to CDC’s National Health Interview Survey analysis. The population differs from the two polls above.
- 685 of 1,039 users, or 65.9%: no recorded direction of symptom change in a September 2026 BPC-157 clinical-note preprint. This is a documentation gap, not a treatment-failure rate.
- More than 80 worldwide: peptide drugs described in a 2022 review. That historical figure is not a current FDA-only approval count.
How much did these five peptide drug brands sell?
Ozempic, Rybelsus, Wegovy, Mounjaro, and Zepbound recorded about $71.0 billion in worldwide sales in 2025. The same group recorded $45.7 billion in 2024 and $26.5 billion in 2023. These are manufacturer sales, not patients’ out-of-pocket bills. Company reports and exchange rates.
| Brand | Active ingredient | 2023 | 2024 | 2025 |
|---|---|---|---|---|
| Ozempic | Semaglutide | $13.89 | $17.45 | $19.21 |
| Rybelsus | Semaglutide | $2.72 | $3.38 | $3.34 |
| Wegovy | Semaglutide | $4.55 | $8.44 | $11.95 |
| Mounjaro | Tirzepatide | $5.16 | $11.54 | $22.97 |
| Zepbound | Tirzepatide | $0.18 | $4.93 | $13.54 |
| Total | Two active ingredients | $26.50 | $45.74 | $71.01 |
Source: Peptide Care Index calculations from Novo Nordisk’s 2025 and 2024 reports, Lilly’s 2025 and 2024 results, and IRS-listed annual average rates. Checked October 14, 2026. Totals use unrounded calculations; displayed rows may differ slightly when added.
What is—and is not—in this comparison?
This is the Peptide Care Index Two-Molecule Sales Benchmark: the same five brands tracked each year. A molecule here means the active drug ingredient. Ozempic, Rybelsus, and Wegovy contain semaglutide; Mounjaro and Zepbound contain tirzepatide. Novo Nordisk · Lilly.
A peptide is a short chain of amino acids, the building blocks of proteins. “Peptide” is a broad term, not one treatment or one product category. NHGRI definition.
The benchmark is deliberately narrow. It excludes other peptide medicines, compounded products, clinic fees, supplements, cosmetics, and research-use products. It is not a ranking of every peptide brand. To check a specific care claim, use our peptide access overview.
Why include Rybelsus?
Rybelsus added $3.34 billion in 2025, or 9.7% of this group’s semaglutide sales. A total that counts only Ozempic and Wegovy leaves out that reporting line. The original figures and the calculation are in the download. Novo Nordisk’s sales table · Exchange rate.
What drove the sales increase in 2025?
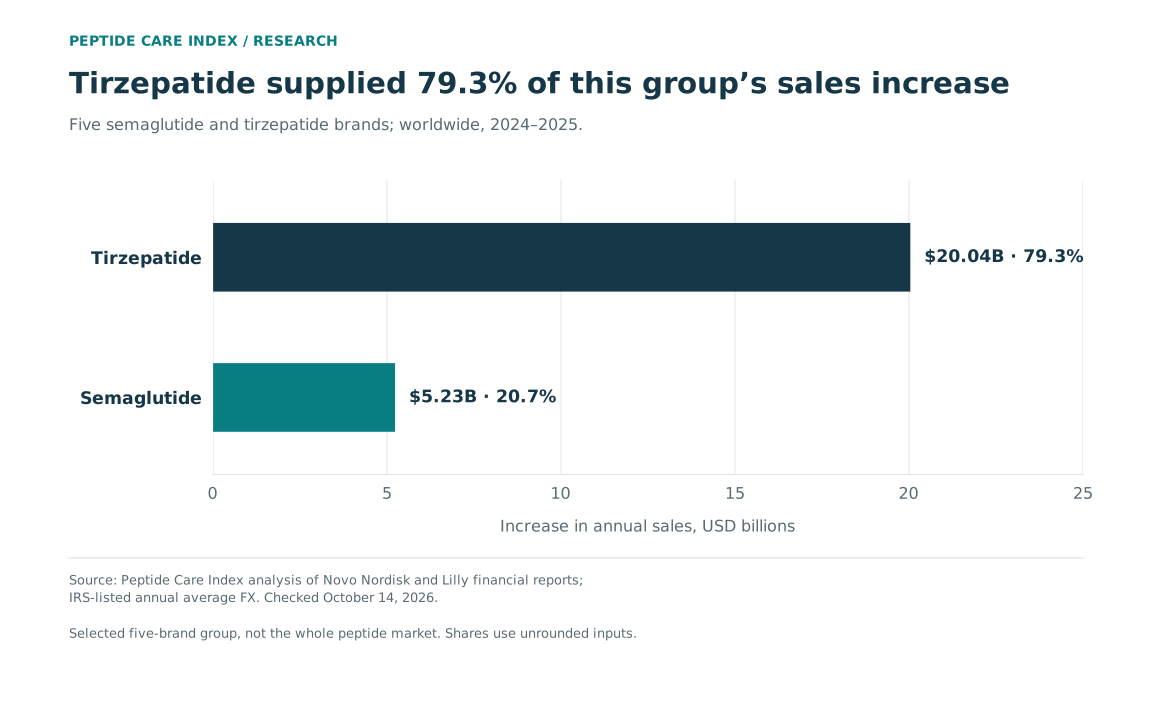
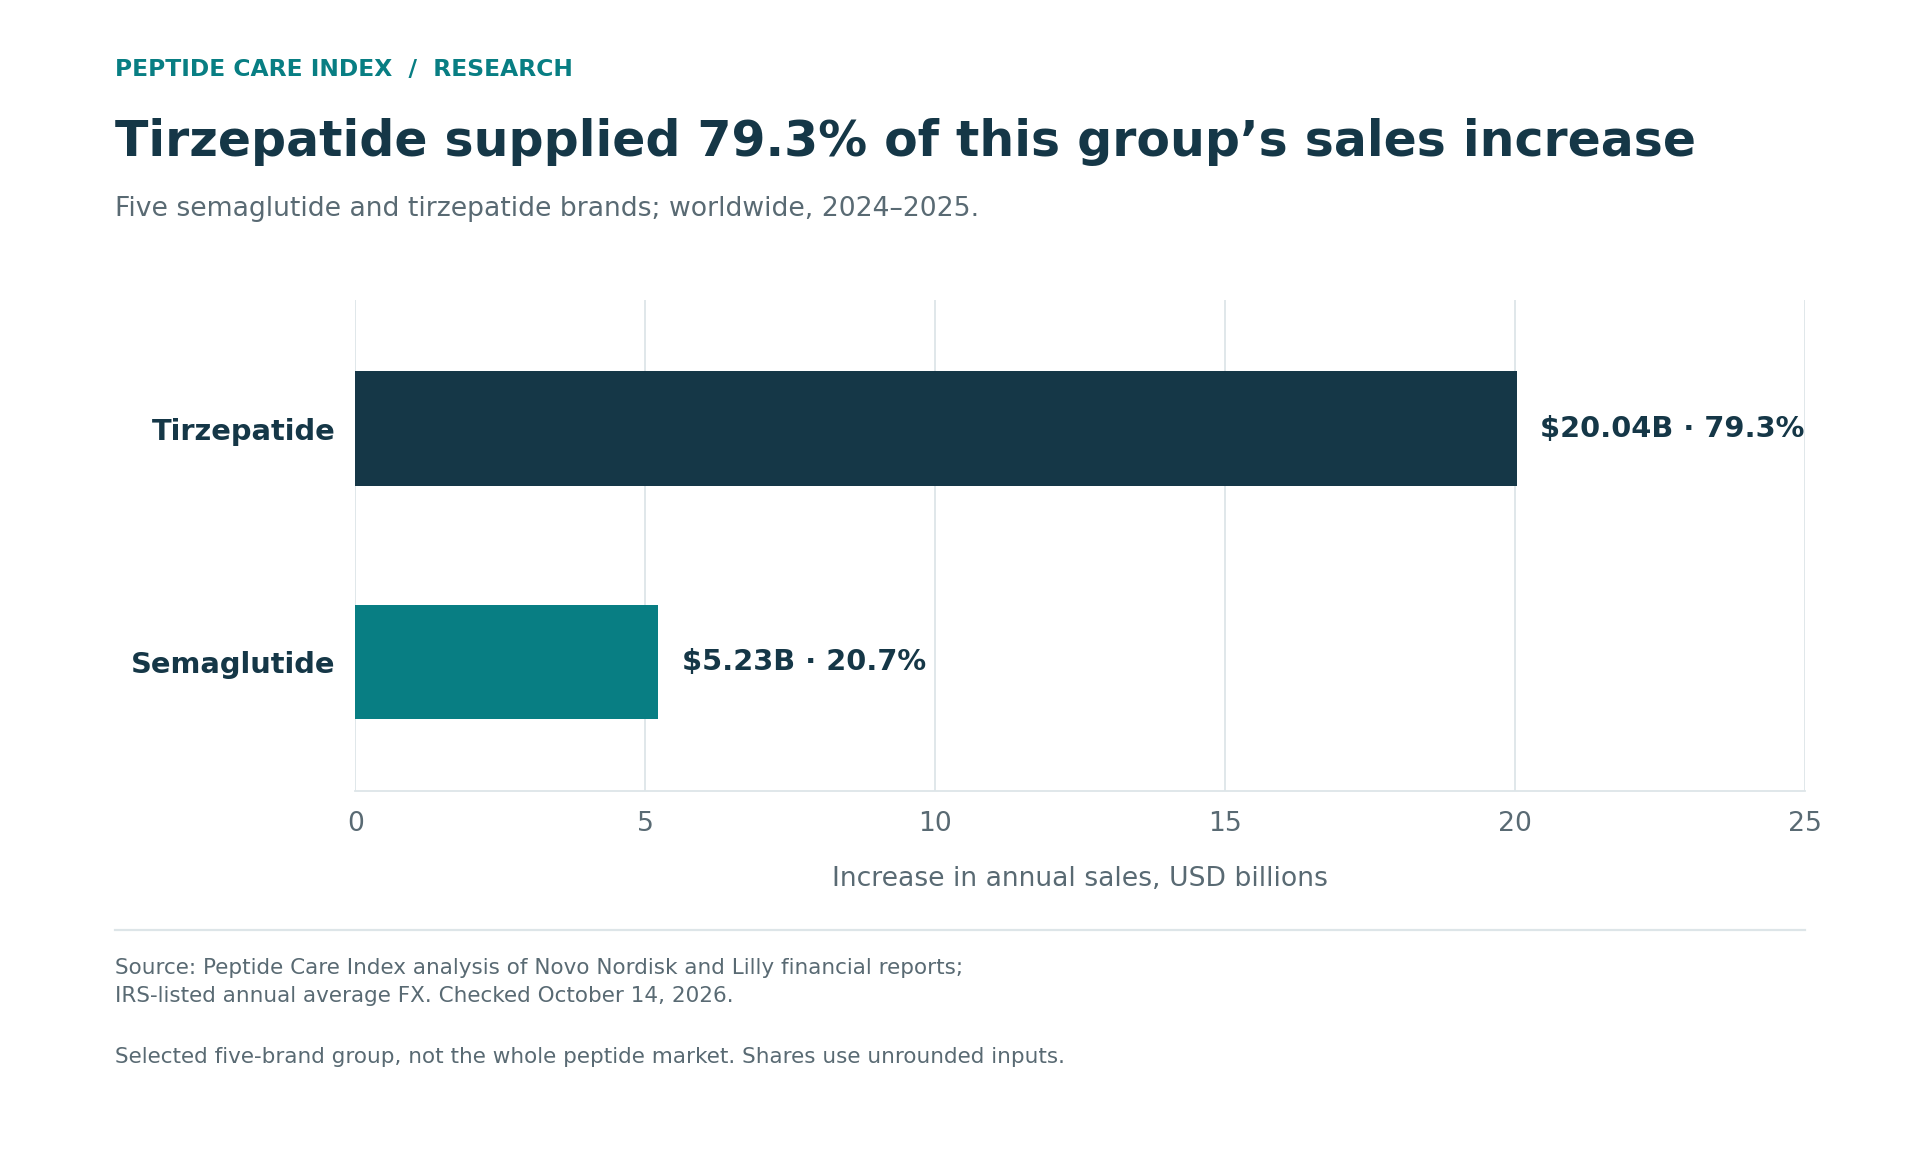
Tirzepatide supplied $20.04 billion of the group’s $25.27 billion increase from 2024 to 2025. That is 79.3% of the increase. Semaglutide supplied the remaining 20.7% in this annual-average-dollar comparison. Calculation from Sources 1–5.
| Active ingredient | 2024 sales | 2025 sales | Increase | Share of increase |
|---|---|---|---|---|
| Semaglutide | $29.27B | $34.50B | $5.23B | 20.7% |
| Tirzepatide | $16.47B | $36.51B | $20.04B | 79.3% |
| Total | $45.74B | $71.01B | $25.27B | 100% |
Source: Peptide Care Index analysis of Novo Nordisk 2025 and 2024, Lilly 2025 and 2024, and annual exchange rates. Worldwide manufacturer sales; checked October 14, 2026. Shares use unrounded inputs.
For every $100 added to this group’s annual sales, about $79 came from Mounjaro and Zepbound. That does not mean tirzepatide held 79.3% of the peptide market. The denominator is the increase in these five brands’ sales.
How have these sales changed since 2023?
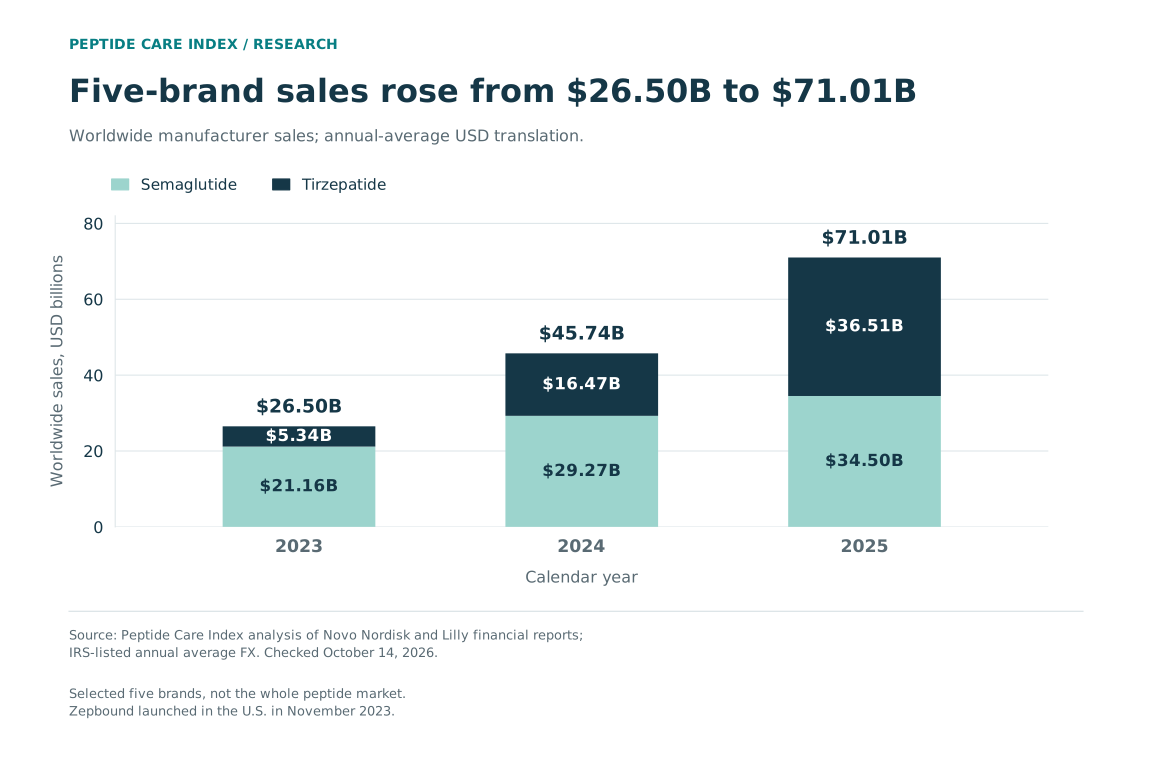
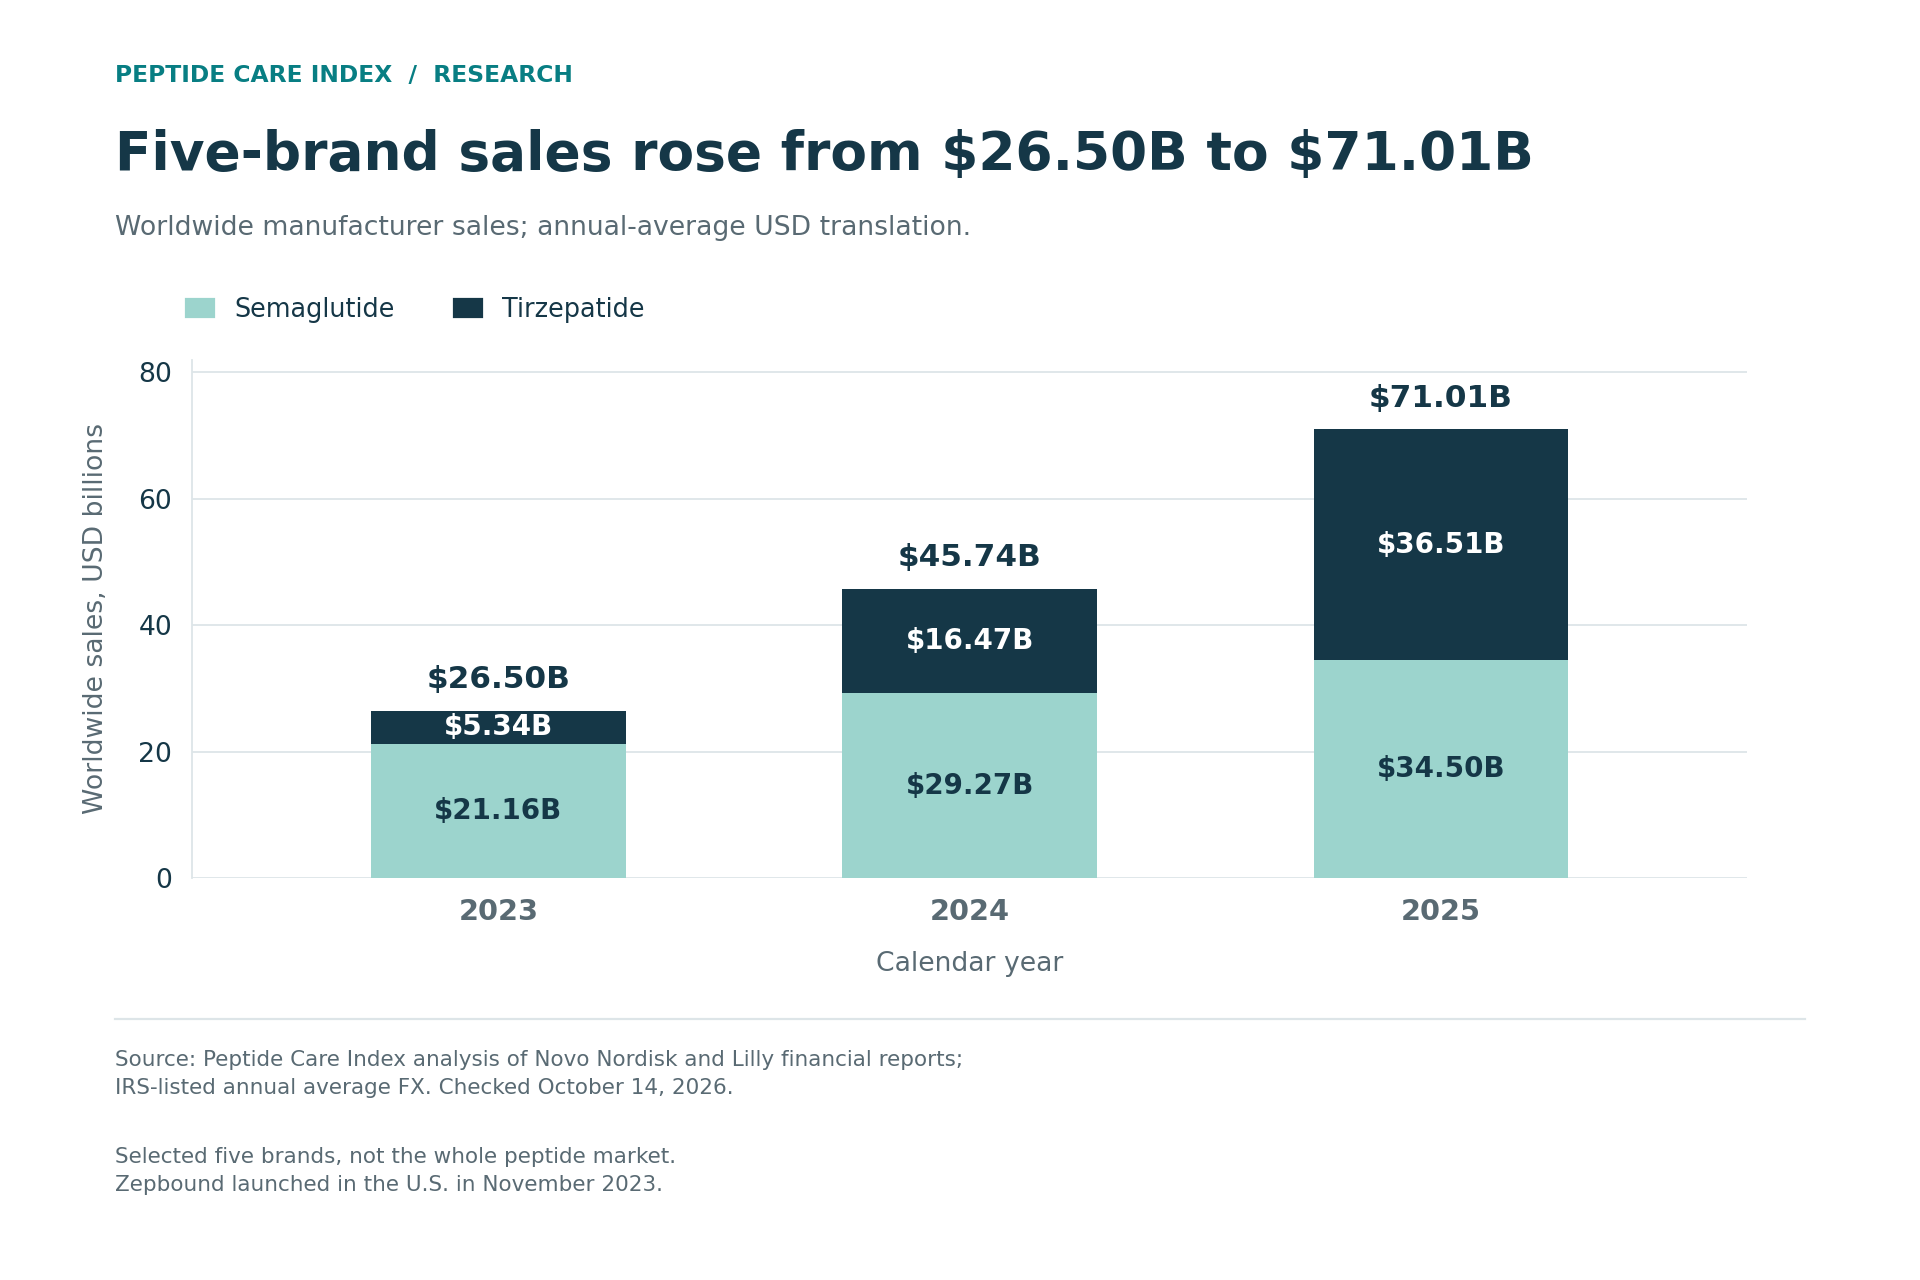
The five-brand total rose from $26.50 billion in 2023 to $71.01 billion in 2025—2.68 times as much. This is a comparison of recorded years, not a forecast. Zepbound launched in the U.S. in November 2023, so its first year in the table is a short launch period. Lilly’s launch-date statement.
| Year | Semaglutide | Tirzepatide | Total |
|---|---|---|---|
| 2023 | $21.16 | $5.34 | $26.50 |
| 2024 | $29.27 | $16.47 | $45.74 |
| 2025 | $34.50 | $36.51 | $71.01 |
Source: Peptide Care Index calculations from Novo Nordisk 2025 and 2024, Lilly 2025 and 2024, and IRS-listed rates. Checked October 14, 2026.
How large is the whole peptide therapeutics market?
The two market publishers checked here give different 2025 estimates: $52.59 billion from Precedence Research and $140.9 billion from Grand View Research. Both use the label “peptide therapeutics.” Their public pages do not provide enough detail to reconcile the totals. Precedence Research · Grand View Research.
| Publisher | Data year | Estimate | How to describe it |
|---|---|---|---|
| Precedence Research | 2025 | $52.59 billion | Publisher estimate; underlying model not independently reproduced |
| Grand View Research | 2025 | $140.9 billion | Publisher estimate; underlying model not independently reproduced |
Source: Each publisher’s own report page, checked October 14, 2026. These are attributed estimates, not independently verified market totals. Precedence’s page displays a September 22, 2026 update.
Our $71.0 billion figure answers a narrower, reproducible question: what did five named reporting lines add up to? It is not a substitute for a complete market census. Do not average the publisher estimates, call them a proven range, or use either as a market-share denominator without matching the definitions first.
Sales also do not tell you what care will cost. For that, compare the published peptide provider terms, including what is billed now and what renews.
How many U.S. adults use GLP-1 medicines?
KFF found 12% current use in its February–March 2026 poll. Gallup found 11% current use for weight loss in its May–June 2026 survey. The questions differ; these two results do not establish a fall in use. KFF’s questionnaire · Gallup’s revised results.
GLP-1 stands for glucagon-like peptide-1, a hormone involved in blood-sugar control. The survey label covers medicines such as semaglutide and tirzepatide. It does not cover every peptide product. CDC · KFF question wording.
| Survey | Dates surveyed | Current use | Ever used | Full sample | What was asked |
|---|---|---|---|---|---|
| KFF | February 24–March 2, 2026 | 12% | 18% | 1,343 adults | Use for weight loss or a chronic condition |
| Gallup | May 28–June 5, 2026 | 11% | 15% | 5,065 adults | Use for weight loss; September 8 revised estimates |
Source: KFF report and topline, Q9; Gallup report and methods. Checked October 14, 2026. These are weighted self-reports, not counts of filled prescriptions.
“Ever used” already includes current users. Do not add those percentages. KFF reports a full-sample sampling margin of ±3 percentage points; that is not a margin for every subgroup. KFF methodology, page 1.
What changes among adults with diagnosed diabetes?
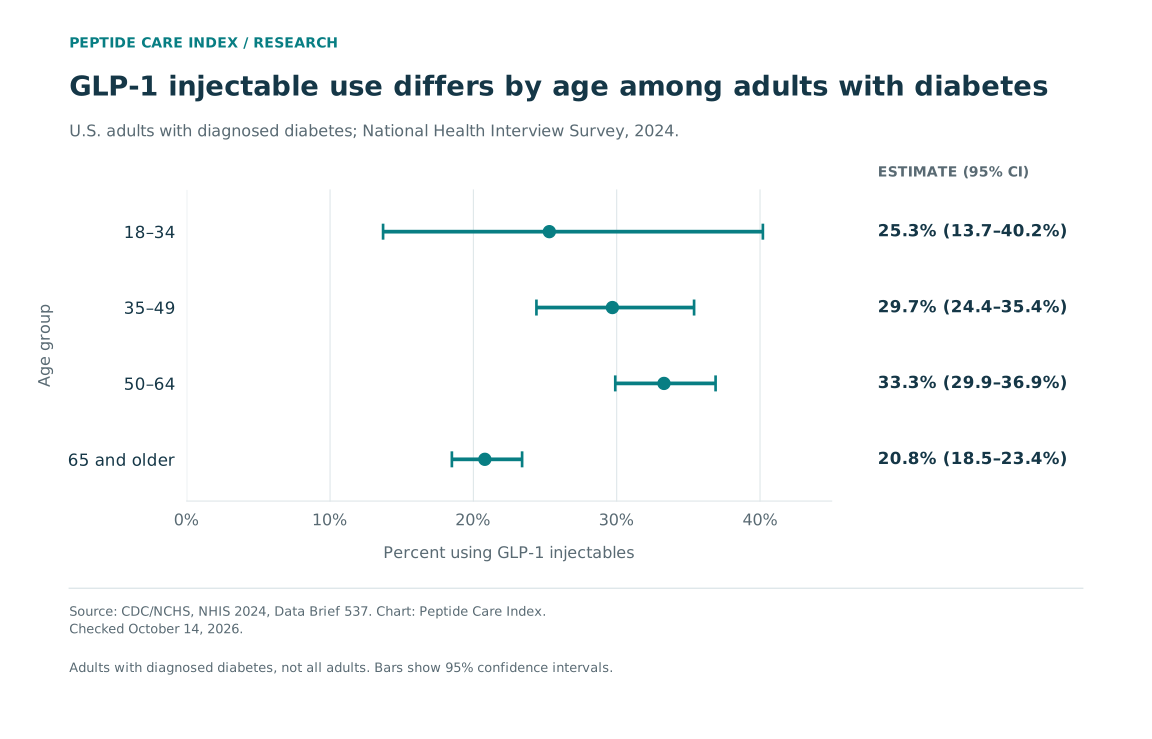
CDC estimated 26.5% GLP-1 injectable use among U.S. adults with diagnosed diabetes in 2024. Its age-group estimates run from 20.8% for adults 65 and older to 33.3% for ages 50–64. These describe that diabetes population, not all adults. CDC/NCHS Data Brief 537.
| Age group | Estimated use | 95% confidence interval |
|---|---|---|
| All adults with diagnosed diabetes | 26.5% | 24.7–28.5% |
| 18–34 | 25.3% | 13.7–40.2% |
| 35–49 | 29.7% | 24.4–35.4% |
| 50–64 | 33.3% | 29.9–36.9% |
| 65 and older | 20.8% | 18.5–23.4% |
Source: CDC/NCHS, National Health Interview Survey 2024, Data Brief 537, Figure 1 data table. Checked October 14, 2026. CI means confidence interval: an uncertainty interval around a survey estimate. The youngest group’s wide interval should stay visible.
CDC’s estimate comes from a question about injectable medicine other than insulin for blood sugar or weight loss. The researchers treated a “yes” answer as GLP-1 use. It is not an audit of each person’s prescription. CDC definitions.
What do the BPC-157 human-use records show?
A September 2026 paper identified 1,039 people with documented BPC-157 use in a selected U.S. clinical-note network. For 685, or 65.9%, it found no recorded direction of symptom change. The records cover 2020 through the second quarter of 2026. The paper was a preprint—not yet peer reviewed—when checked. Venkatakrishnan and colleagues.
| Detail | Recorded | Not recorded | Not recorded, % |
|---|---|---|---|
| Use duration | 130 | 909 | 87.5% |
| Direction of symptom response | 354 | 685 | 65.9% |
| Reason for use | 644 | 395 | 38.0% |
Source: Venkatakrishnan et al., version 1, September 7, 2026, abstract and results. Missing counts and percentages calculated from the reported counts; checked October 14, 2026. Each row has the same denominator; categories overlap.
The researchers used AI-assisted extraction of clinical notes with physician checks. This table measures what was recorded, not whether the drug worked. Other therapeutic agents were documented for 525 of the 1,039 users, so changes cannot be assigned to BPC-157 alone. Preprint.
Missing notes are not failed treatment. Nor do they prove an absence of harm. We excluded supply-source percentages because the paper’s prose and table use different counts.
How many peptide drugs are FDA-approved?
The familiar “more than 80” figure describes peptide drugs worldwide in a 2022 review. It is not a current FDA-only total. This page does not relabel the historical number as a new approval count. Wang and colleagues.
A count needs a clear unit. Our sales table has five brands but two active ingredients. An approval list can also count brands, ingredients, or formulations; those totals are not interchangeable.
What do FDA records say about BPC-157 and TB-500?
In its 2026 staff briefings, FDA said neither evaluated BPC-157 form nor either evaluated TB-500 fragment form was an ingredient in an FDA-approved drug. Those are findings in the dated records. They are not a final compounding rule or a complete approval-database check through October. BPC-157 briefing, page 9 · TB-500 briefing, page 7.
| Record | Substance covered | Finding in the briefing | Scope to keep |
|---|---|---|---|
| BPC-157 staff evaluation, May 11, 2026 | BPC-157 free base and acetate | Neither form was an ingredient in an FDA-approved drug | The finding applies to the forms evaluated |
| TB-500 staff evaluation, May 15, 2026 | The evaluated free-base and acetate forms of the LKKTETQ fragment | Neither form was an ingredient in an FDA-approved drug | The short fragment is not full-length thymosin beta-4 |
Source: FDA briefings, printed pages 9 and 7; fragment distinction on printed page 25 of the TB-500 briefing. Page images checked October 14, 2026. Staff briefings are not final agency rules.
FDA also states that compounded drugs are not FDA-approved. An approved ingredient, an advertised service, and an approved finished drug are different claims. Our questions to ask before paying help keep the exact product and offer in view. FDA compounding Q&A.
How did we build these peptide statistics?
Peptide Care Index checked 15 brand-year sales rows covering 2023–2025 against published company tables on October 14, 2026. We kept the original currencies, translated them into one currency, and calculated the totals and changes. The figures below let you repeat the work.
Which sales figures did we start with?
| Brand | Year | Reported sales, millions | Currency | Source |
|---|---|---|---|---|
| Ozempic | 2023 | 95,718 | DKK | S2 |
| Ozempic | 2024 | 120,342 | DKK | S2 |
| Ozempic | 2025 | 127,089 | DKK | S1 |
| Rybelsus | 2023 | 18,750 | DKK | S2 |
| Rybelsus | 2024 | 23,301 | DKK | S2 |
| Rybelsus | 2025 | 22,093 | DKK | S1 |
| Wegovy | 2023 | 31,343 | DKK | S2 |
| Wegovy | 2024 | 58,206 | DKK | S2 |
| Wegovy | 2025 | 79,106 | DKK | S1 |
| Mounjaro | 2023 | 5,163.1 | USD | S4 |
| Mounjaro | 2024 | 11,540.1 | USD | S4 |
| Mounjaro | 2025 | 22,965 | USD | S3 |
| Zepbound | 2023 | 175.8 | USD | S4 |
| Zepbound | 2024 | 4,925.7 | USD | S4 |
| Zepbound | 2025 | 13,542 | USD | S3 |
Source: Novo Nordisk 2025 and 2024; Lilly 2025 and 2024. Checked October 14, 2026. These are full-year columns, not fourth-quarter columns.
The 2024 Lilly release gives its 2023 and 2024 figures to one decimal place in millions. Its 2025 release rounds to whole millions. We retain each source’s precision rather than silently rounding the earlier inputs.
How did we convert Danish kroner into dollars?
We divided each Novo Nordisk figure by the matching year’s DKK per U.S. dollar rate. Lilly already reports in dollars, so its figures need no conversion. These are IRS-listed annual averages, not a combined dollar total reported by either company. IRS rates and conversion guidance.
| Sales year | Danish kroner per U.S. dollar |
|---|---|
| 2023 | 6.890 |
| 2024 | 6.896 |
| 2025 | 6.617 |
Source: IRS, yearly average currency exchange rates, Denmark/Krone row. Checked October 14, 2026.
Worked example: Wegovy’s 2025 sales were DKK 79,106 million. Divide by 6.617 to get USD 11,954.964485 million, or $11.95 billion after rounding. Sales source · Rate source.
All shares and growth figures use unrounded calculations. The CSV’s extra decimal places make the calculation traceable; they do not make the underlying reports more precise.
How can you reproduce the headline finding?
First add Mounjaro and Zepbound for each year. Then divide their increase by the whole five-brand group’s increase:
| Calculation | Result |
|---|---|
| Tirzepatide, 2025: $22,965M + $13,542M | $36,507M |
| Tirzepatide, 2024: $11,540.1M + $4,925.7M | $16,465.8M |
| Tirzepatide increase | $20,041.2M |
| Five-brand increase, calculated before rounding | $25,270.980053M |
| $20,041.2M ÷ $25,270.980053M × 100 | 79.3% |
Source: Peptide Care Index calculations from Sources 1–5. M means million U.S. dollars. Checked October 14, 2026; displayed intermediate values are rounded only for reading.
The group’s annual growth uses a different formula: (2025 total ÷ 2024 total − 1) × 100 = 55.3%. Its 2025-to-2023 multiple is 2025 total ÷ 2023 total = 2.68. Neither calculation measures prescription counts or treatment results.
How much does currency translation matter?
As a check, translating Novo Nordisk’s 2025 figures at the 2024 rate would put the group’s 2025 total at $69.6 billion, with 52.2% growth over 2024. That is a sensitivity check: it changes one assumption to show the effect. It is not either company’s constant-currency growth calculation, which accounts for the currencies in which its sales occurred. Reported sales and rates.
The main series uses each year’s annual average rate. It is not adjusted for inflation.
How did we handle the other sources?
Survey percentages stay with their population, question, fieldwork dates, and any revision. We did not turn weighted percentages into exact counts of respondents. The CDC age table keeps its confidence intervals.
For the BPC-157 table, not recorded = 1,039 − recorded, and missing percentage = not recorded ÷ 1,039 × 100. We checked the reported totals, not the underlying private clinical notes. The preprint’s status and the supply-source conflict remain visible.
Market figures are attributed estimates, not our measurements. The approval section describes what its dated sources establish. This is analysis of published records, not a survey or a clinical study conducted by Peptide Care Index. Our research methodology explains that distinction.
Which dates matter when you quote a number?
The sales series ends on December 31, 2025. The U.S. use polls were fielded in 2026; CDC’s diabetes estimates cover 2024. Checking all of them in October 2026 does not turn them into observations from the same month or year.
The files keep the observation period, source date, and check date separate. We have not projected a full 2026 sales total from a partial year.
What can these numbers not tell you?
The five-brand benchmark cannot measure the whole peptide market, the number of patients, or what a patient paid. The surveys cannot supply a national count of BPC-157 or all wellness-peptide users. Clinical-note counts cannot establish a treatment’s benefit or harm rate.
That is why this page has no all-peptide safety score, no national wellness-use estimate, and no state-by-state count. The sources reviewed do not support those results. Large sales are not a reason to choose a treatment; that decision belongs with a qualified clinician.
Researching care for yourself? Find My Peptide Path explains the access evidence and helps you prepare questions about fees, the pharmacy, and the exact offer. It is free and needs no account or email.
How can you cite this page?
Cite Peptide Care Index for the five-brand compilation and the original growth calculation. Keep KFF, Gallup, CDC, the research authors, FDA, or the market publisher named when using their findings. A check date does not replace a figure’s actual data period.
Page citation
Peptide Care Index. “Peptide statistics: $71 billion from five drug brands.” October 2026 edition. Data checked October 14, 2026. https://peptidecareindex.com/research/peptide-statistics/
Growth-finding citation
Tirzepatide supplied 79.3% of the 2024–2025 worldwide sales increase across five semaglutide and tirzepatide brands, according to Peptide Care Index’s October 2026 analysis of company reports.
Go to the growth calculation. The comparison uses annual-average currency translation and the five brands named in the table.
Reuse: You may reuse Peptide Care Index’s original calculations and charts; please credit Peptide Care Index for that work and keep the underlying source credits. Third-party material retains its own attribution and reuse terms.
Where can you download the data?
The free download contains eight CSV files, including all 15 original brand-year sales rows and the inputs behind the other tables. Every data row carries a source and check date. No account or email is required.
| File | Rows | Contents |
|---|---|---|
| Original sales rows | 15 | Brand, year, reported currency, exchange rate, converted value, source and check date |
| Annual totals | 3 | Molecule totals, combined sales and annual growth |
| Growth breakdown | 2 | Increase by molecule and each share of the increase |
| Exchange rates | 3 | Annual Danish-kroner rates and conversion rule |
| U.S. adult use surveys | 4 | Current and ever use; population, question and survey dates |
| Diabetes use by age | 5 | Overall and four age estimates with confidence intervals |
| BPC-157 documentation | 3 | Recorded and missing counts with a shared denominator |
| Market estimates | 2 | Separate producer estimates with base year and attribution |
Source: Files supplied with this edition; source producers are identified in each row. Checked October 14, 2026. Blank fields mean not supplied or not applicable, not zero.
What else do readers ask about peptide statistics?
Is 79.3% tirzepatide’s market share?
No. It is tirzepatide’s share of the increase in this five-brand group’s sales from 2024 to 2025. Tirzepatide made up 51.4% of the group’s total 2025 sales. Neither percentage measures the entire peptide market. Reproducible sales data.
Does a trial count show that a peptide works?
No. Counting registered studies is not the same as counting successful results. A useful total must identify the exact substance, study records, dates, and which studies finished or reported results. This page does not give an unverified current total for all peptide trials.
Does missing BPC-157 response data mean treatment failed?
No. The 685 missing responses in the cited preprint are gaps in documentation. They are not evidence of failure, and recorded improvements do not by themselves prove that BPC-157 caused them. Original preprint.
Does a large drug-sales figure tell me what peptide care costs?
No. $71.0 billion is an annual manufacturer-sales total across the selected brands. It is not a patient price, a clinic fee, or a treatment-course cost. A personal cost comparison needs the exact product, service, and billing terms.
Which sources support these numbers?
All sources below were checked on October 14, 2026. Dates shown with a source describe its report, edition, or data period—not the date we first checked it. The financial tables and cited FDA approval statements were read directly; no patient records or survey respondent files were audited.
Novo Nordisk: Financial report for the period 1 January 2025 to 31 December 2025. Source/report date: 2026-02-03. Sales split per therapy; full-year 2025 column. Report dated February 3; Form 6-K filed February 4, 2026. Checked October 14, 2026.
Novo Nordisk: Financial report for the period 1 January 2024 to 31 December 2024. Source/report date: 2025-02-05. Sales split per therapy; full-year 2024 and 2023 columns. Checked October 14, 2026.
Lilly reports fourth-quarter 2025 financial results and provides 2026 guidance. Source/report date: 2026-02-04. Selected Revenue Highlights; Full Year 2025, Mounjaro and Zepbound rows. Checked October 14, 2026.
Lilly reports full Q4 2024 financial results and provides 2025 guidance. Source/report date: 2025-02-06. Selected Revenue Highlights; Full Year 2024 and 2023. Zepbound paragraph records November 2023 U.S. launch. Checked October 14, 2026.
IRS: Yearly average currency exchange rates. Denmark / Krone row; 2023, 2024 and 2025. Rates are currency units per U.S. dollar. Checked October 14, 2026.
KFF: Public views on prescription drug costs, regulation, affordability, and TrumpRx. Source/report date: 2026-03-13. GLP-1 use and methodology; fieldwork February 24–March 2, 2026. Checked October 14, 2026.
KFF Health Tracking Poll: March 2026 topline. Source/report date: 2026-03. Printed page 1: method; printed page 5: Q9, 3/26 column. Both coincide with zero-index PDF pages 1 and 5. Checked October 14, 2026.
Gallup: In U.S., GLP-1 usage reaches new high. Source/report date: 2026-07-07. Estimates revised September 8, 2026; fieldwork May 28–June 5, 2026; survey methods. Checked October 14, 2026.
CDC/NCHS Data Brief 537: GLP-1 injectable use among adults with diagnosed diabetes, United States, 2024. Source/report date: 2025-08. Figure 1 data table; Definitions; Data source and methods. Visible report heading and suggested citation say August 2025, despite July in browser title. Checked October 14, 2026.
Venkatakrishnan et al.: Rising Use of Unapproved BPC-157 and Associated Patient-Reported Outcomes Curated from Clinical Notes. Source/report date: 2026-09-07. Version 1; abstract, section 3.2, Table 2 and sections on reasons and responses. Not peer reviewed when checked. Checked October 14, 2026.
Grand View Research: Peptide therapeutics market. Source publication/update month: June 2026. Market Size 2025: USD 140.9 billion. Publisher estimate; underlying model not independently reproduced. Checked October 14, 2026.
Precedence Research: Peptide therapeutics market companies, size and trends 2026–2035. Source/report date: 2026-09-22. Opening 2025 global market estimate: USD 52.59 billion; displayed update September 22, 2026. Checked October 14, 2026.
Wang et al.: Therapeutic peptides: current applications and future directions. Source/report date: 2022-02-14. Introduction and conclusion: more than 80 peptide drugs worldwide / therapeutic peptides reaching the global market. DOI: 10.1038/s41392-022-00904-4. Checked October 14, 2026.
FDA: BPC-157 briefing for the July 2026 Pharmacy Compounding Advisory Committee meeting. Source/report date: 2026-05-11. Printed page 9 (zero-index PDF page 8): approval/monograph statement for free base and acetate. Staff evaluation, not a final rule. Checked October 14, 2026.
FDA: TB-500 briefing for the July 2026 Pharmacy Compounding Advisory Committee meeting. Source/report date: 2026-05-15. Printed page 7 (PDF index 6): approval statement; printed page 25 (PDF index 24): exact fragment versus full-length thymosin beta-4. Checked October 14, 2026.
FDA: Compounding and the FDA, questions and answers. Are compounded drugs approved by FDA? and comparison with generic drugs. Checked October 14, 2026.
National Human Genome Research Institute: Peptide. Definition of peptide as an amino-acid chain. Checked October 14, 2026.